- DATE:
- AUTHOR:
- The Launchable Product Team
New insights: Introducing the testing trends dashboard
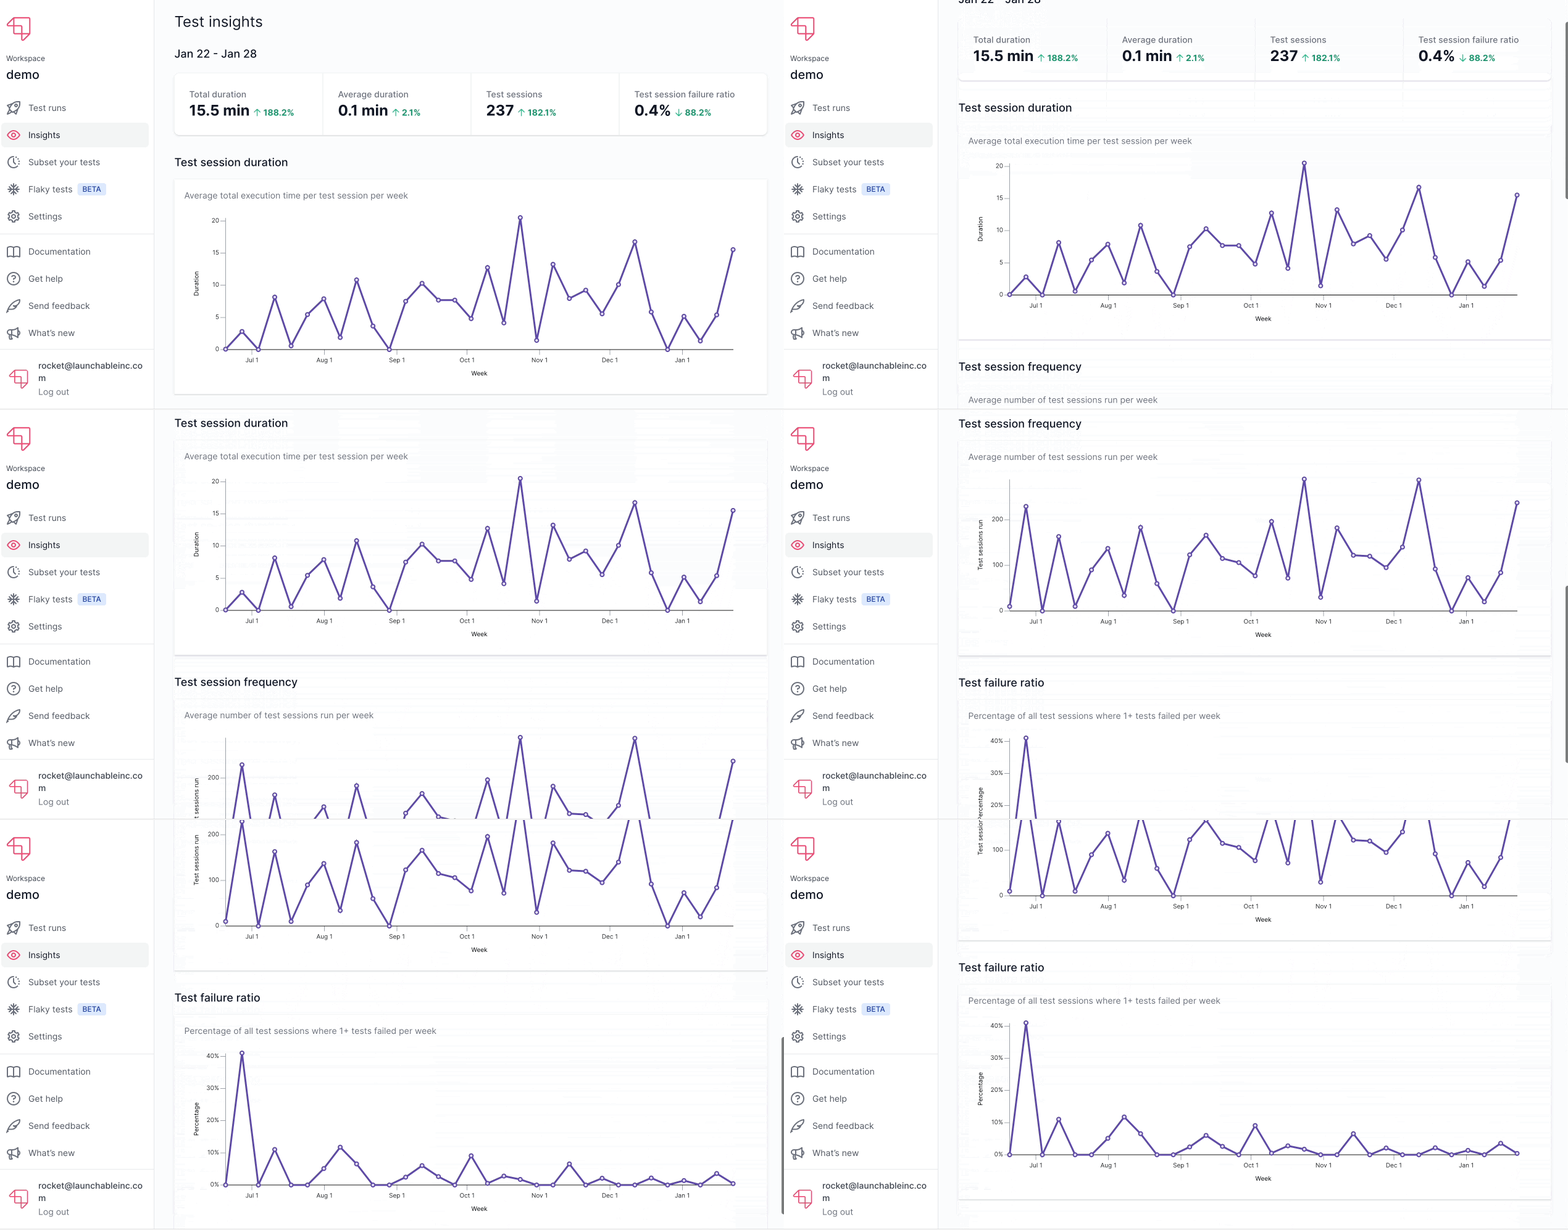
Today we're pleased to release the first version of a new set of insights designed to surface testing trends. Once you've started sending data to Launchable, you can now view three new graphs in the Launchable webapp:
Test session duration over time,
Test session frequency over time, and
Test session failure ratio over time

These graphs provide new visibility into the evolution of your test suite that can be hard to get without Launchable. For example, you can now spot increases in test session duration that can be amplified by increased frequency (perhaps due to team growth). Similarly, you can see if your test sessions have started failing more often -- perhaps an indicator that a test or recent change needs looking into.
Enjoy the new dashboard! We look forward to surfacing more information like this as we expand this area of our product.